
|
|
||
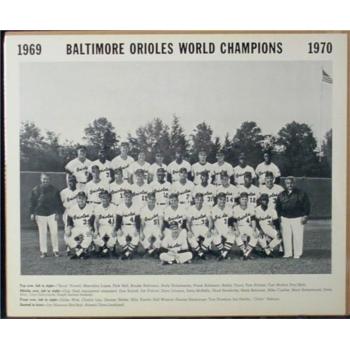
| 1969 Baltimore Orioles | Home Field: Memorial Stadium | |
| AL Champions | Hit: #2 R; #2 BA | |
| W - 109 L - 53 (.673) 19GA | Pitch: #1 RA, ERA | |
| Manager: Earl Weaver | Def: #1 FA |
|
1969 BALTIMORE ORIOLES TEAM ROSTER
|
|||||||
| Pitchers | |||||||
| No. | Name | Pos | Bats | Throws | Height | Weight | Born |
| -- | Adamson, Mike | P | R | R | 6'2" | 185 | 9/13/1947 |
| -- | Beene, Fred | P | B | R | 5'9" | 155 | 11/24/1942 |
| -- | Bertaina, Frank | P | L | L | 5'11" | 177 | 4/14/1944 |
| -- | Cuellar, Mike | P | L | L | 6'0" | 165 | 5/8/1937 |
| -- | Hall, Dick | P | R | R | 6'6" | 200 | 9/27/1930 |
| -- | Hardin, Jim | P | R | R | 6'0" | 175 | 8/6/1943 |
| -- | Leonhard, Dave | P | R | R | 5'11" | 165 | 1/22/1941 |
| -- | Lopez, Marcelino | P | R | L | 6'3" | 195 | 9/23/1943 |
| -- | McNally, Dave | P | R | L | 5'11" | 185 | 10/31/1942 |
| -- | Palmer, Jim | P | R | R | 6'3" | 190 | 10/15/1945 |
| -- | Phoebus, Tom | P | R | R | 5'8" | 185 | 4/7/1942 |
| -- | Richert, Pete | P | L | L | 5'11" | 165 | 10/29/1939 |
| -- | Severinsen, Al | P | R | R | 6'3" | 220 | 11/9/1944 |
| -- | Watt, Eddie | P | R | R | 5'10" | 183 | 4/4/1941 |
| Catchers | |||||||
| No. | Name | Pos | Bats | Throws | Height | Weight | Born |
| -- | Dalrymple, Clay | C | L | R | 6'0" | 190 | 12/3/1936 |
| -- | Etchebarren, Andy | C | R | R | 6'1" | 190 | 6/20/1943 |
| -- | Hendricks, Ellie | C | L | R | 6'1" | 175 | 12/22/1940 |
| Infielders | |||||||
| No. | Name | Pos | Bats | Throws | Height | Weight | Born |
| -- | Belanger, Mark | SS | R | R | 6'1" | 170 | 6/8/1944 |
| -- | Crowley, Terry | 1B | L | L | 6'0" | 180 | 2/16/1947 |
| -- | Floyd, Bobby | 2B | R | R | 6'1" | 180 | 10/20/1943 |
| -- | Johnson, Dave | 2B | R | R | 6'1" | 170 | 1/30/1943 |
| -- | Powell, Boog | 1B | L | R | 6'4" | 230 | 8/17/1941 |
| -- | Robinson, Brooks | 3B | R | R | 6'1" | 180 | 5/18/1937 |
| -- | Salmon, Chico | 1B | R | R | 5'10" | 160 | 12/3/1940 |
| Outfielders | |||||||
| No. | Name | Pos | Bats | Throws | Height | Weight | Born |
| -- | Blair, Paul | -- | R | R | 6'0" | 168 | 2/1/1944 |
| -- | Buford, Don | -- | B | R | 5'7" | 160 | 2/2/1937 |
| -- | May, Dave | -- | L | R | 5'10" | 186 | 12/23/1943 |
| -- | Motton, Curt | -- | R | R | 5'8" | 164 | 9/24/1940 |
| -- | Rettenmund, Merv | -- | R | R | 5'10" | 190 | 6/6/1943 |
| -- | Robinson, Frank | -- | R | R | 6'1" | 183 | 8/31/1935 |
|
1969 BALTIMORE ORIOLES TEAM BATTING STATS
|
||||||||||||||||||
| Player | AVG | G | AB | R | H | 2B | 3B | HR | RBI | BB | K | HBP | SB | CS | GDP | OBP | SLG | OPS |
| Bertaina, Frank | 1.000 | 3 | 1 | 0 | 1 | 0 | 0 | 0 | 0 | 1 | 0 | 0 | 0 | 0 | 0 | 1 | 1 | 2 |
| Crowley, Terry | 0.333 | 7 | 18 | 2 | 6 | 0 | 0 | 0 | 3 | 1 | 4 | 0 | 0 | 0 | 0 | 0.35 | 0.333 | 0.683 |
| Severinsen, Al | 0.333 | 12 | 3 | 0 | 1 | 0 | 0 | 0 | 0 | 0 | 1 | 0 | 0 | 0 | 0 | 0.333 | 0.333 | 0.667 |
| Robinson, Frank | 0.308 | 148 | 539 | 111 | 166 | 19 | 5 | 32 | 100 | 88 | 62 | 13 | 9 | 3 | 12 | 0.415 | 0.54 | 0.955 |
| Powell, Boog | 0.304 | 152 | 533 | 83 | 162 | 25 | 0 | 37 | 121 | 72 | 76 | 1 | 1 | 1 | 18 | 0.383 | 0.559 | 0.942 |
| Motton, Curt | 0.303 | 56 | 89 | 15 | 27 | 6 | 0 | 6 | 21 | 13 | 10 | 1 | 3 | 1 | 0 | 0.398 | 0.573 | 0.971 |
| Salmon, Chico | 0.297 | 52 | 91 | 18 | 27 | 5 | 0 | 3 | 12 | 10 | 22 | 2 | 0 | 0 | 1 | 0.375 | 0.451 | 0.826 |
| Buford, Don | 0.291 | 144 | 554 | 99 | 161 | 31 | 3 | 11 | 64 | 96 | 62 | 5 | 19 | 18 | 5 | 0.397 | 0.417 | 0.814 |
| Belanger, Mark | 0.287 | 150 | 530 | 76 | 152 | 17 | 4 | 2 | 50 | 53 | 54 | 2 | 14 | 6 | 13 | 0.351 | 0.345 | 0.696 |
| Hall, Dick | 0.286 | 39 | 7 | 1 | 2 | 0 | 0 | 0 | 2 | 1 | 1 | 0 | 1 | 0 | 0 | 0.375 | 0.286 | 0.661 |
| Blair, Paul | 0.285 | 150 | 625 | 102 | 178 | 32 | 5 | 26 | 76 | 40 | 72 | 2 | 20 | 6 | 11 | 0.327 | 0.477 | 0.804 |
| Johnson, Dave | 0.280 | 142 | 511 | 52 | 143 | 34 | 1 | 7 | 57 | 57 | 52 | 3 | 3 | 4 | 16 | 0.351 | 0.391 | 0.743 |
| Etchebarren, Andy | 0.249 | 73 | 217 | 29 | 54 | 9 | 2 | 3 | 26 | 28 | 42 | 7 | 1 | 2 | 11 | 0.35 | 0.35 | 0.701 |
| Rettenmund, Merv | 0.247 | 95 | 190 | 27 | 47 | 10 | 3 | 4 | 25 | 28 | 28 | 0 | 6 | 1 | 6 | 0.338 | 0.395 | 0.733 |
| Hendricks, Ellie | 0.244 | 105 | 295 | 36 | 72 | 5 | 0 | 12 | 38 | 39 | 44 | 2 | 0 | 1 | 3 | 0.333 | 0.383 | 0.716 |
| May, Dave | 0.242 | 78 | 120 | 8 | 29 | 6 | 0 | 3 | 10 | 9 | 23 | 2 | 2 | 1 | 5 | 0.305 | 0.367 | 0.672 |
| Dalrymple, Clay | 0.238 | 37 | 80 | 8 | 19 | 1 | 1 | 3 | 6 | 13 | 8 | 0 | 0 | 0 | 6 | 0.34 | 0.388 | 0.728 |
| Robinson, Brooks | 0.234 | 156 | 598 | 73 | 140 | 21 | 3 | 23 | 84 | 56 | 55 | 3 | 2 | 1 | 19 | 0.298 | 0.395 | 0.693 |
| Lopez, Marcelino | 0.214 | 27 | 14 | 2 | 3 | 0 | 0 | 0 | 0 | 3 | 5 | 0 | 0 | 0 | 0 | 0.353 | 0.214 | 0.567 |
| Palmer, Jim | 0.203 | 27 | 64 | 5 | 13 | 3 | 0 | 0 | 6 | 3 | 30 | 0 | 0 | 0 | 1 | 0.235 | 0.25 | 0.485 |
| Floyd, Bobby | 0.202 | 39 | 84 | 7 | 17 | 4 | 0 | 0 | 1 | 6 | 17 | 0 | 0 | 0 | 4 | 0.253 | 0.25 | 0.503 |
| Phoebus, Tom | 0.200 | 35 | 75 | 8 | 15 | 2 | 0 | 0 | 4 | 3 | 26 | 0 | 0 | 0 | 4 | 0.231 | 0.227 | 0.457 |
| Hardin, Jim | 0.156 | 30 | 45 | 5 | 7 | 0 | 0 | 2 | 6 | 2 | 15 | 0 | 0 | 0 | 0 | 0.191 | 0.289 | 0.48 |
| Richert, Pete | 0.125 | 44 | 8 | 0 | 1 | 0 | 0 | 0 | 0 | 0 | 4 | 0 | 1 | 0 | 0 | 0.125 | 0.125 | 0.25 |
|
1969 BALTIMORE ORIOLES TEAM PITCHING STATS
|
|||||||||||||||||
| Player | ERA | W | L | SV | G | GS | CG | ShO | IP | H | R | ER | HR | BB | K | RATIO | BAVG |
| Beene, Fred | 0 | 0 | 0 | 0 | 2 | 0 | 0 | 0 | 2.2 | 2 | 0 | 0 | 0 | 1 | 0 | 1.36 | 0.2 |
| Bertaina, Frank | 0 | 0 | 0 | 0 | 3 | 0 | 0 | 0 | 6 | 1 | 0 | 0 | 0 | 3 | 5 | 0.67 | 0.06 |
| Watt, Eddie | 1.65 | 5 | 2 | 16 | 56 | 0 | 0 | 0 | 71 | 49 | 18 | 13 | 3 | 26 | 46 | 1.06 | 0.19 |
| Hall, Dick | 1.92 | 5 | 2 | 6 | 39 | 0 | 0 | 0 | 65.2 | 49 | 14 | 14 | 3 | 9 | 31 | 0.89 | 0.21 |
| Richert, Pete | 2.2 | 7 | 4 | 12 | 44 | 0 | 0 | 0 | 57.1 | 42 | 17 | 14 | 7 | 14 | 54 | 0.98 | 0.2 |
| Severinsen, Al | 2.29 | 1 | 1 | 0 | 12 | 0 | 0 | 0 | 19.2 | 14 | 6 | 5 | 2 | 10 | 13 | 1.25 | 0.21 |
| Palmer, Jim | 2.34 | 16 | 4 | 0 | 26 | 23 | 11 | 6 | 181 | 131 | 48 | 47 | 11 | 64 | 123 | 1.08 | 0.2 |
| Cuellar, Mike | 2.38 | 23 | 11 | 0 | 39 | 39 | 18 | 5 | 290 | 213 | 94 | 77 | 18 | 79 | 182 | 1.01 | 0.2 |
| Leonhard, Dave | 2.49 | 7 | 4 | 1 | 37 | 3 | 1 | 1 | 94 | 78 | 28 | 26 | 8 | 38 | 37 | 1.23 | 0.23 |
| McNally, Dave | 3.22 | 20 | 7 | 0 | 41 | 40 | 11 | 4 | 268 | 232 | 103 | 96 | 21 | 84 | 166 | 1.18 | 0.23 |
| Phoebus, Tom | 3.52 | 14 | 7 | 0 | 35 | 33 | 6 | 2 | 202 | 180 | 89 | 79 | 23 | 87 | 117 | 1.32 | 0.24 |
| Hardin, Jim | 3.6 | 6 | 7 | 1 | 30 | 20 | 3 | 1 | 137 | 128 | 62 | 55 | 18 | 43 | 64 | 1.25 | 0.25 |
| Lopez, Marcelino | 4.41 | 5 | 3 | 0 | 27 | 4 | 0 | 0 | 69.1 | 65 | 34 | 34 | 3 | 34 | 57 | 1.43 | 0.25 |
| Adamson, Mike | 4.5 | 0 | 1 | 0 | 6 | 0 | 0 | 0 | 8 | 10 | 4 | 4 | 0 | 6 | 2 | 2 | 0.36 |